Численные методы обучения по прецедентам (практика, В.В. Стрижов)/Примеры
Материал из MachineLearning.
The source code to these examples is placed on Sourceforge.net, MVR Composer project
Title: Principal Component Analysis
- Folder: PrincipalComponent
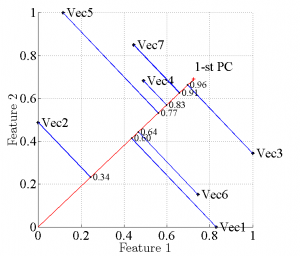
- Description: Demo plots the 1st Principal Component of the 2D sample set. The script uses a standard 1PC procedure.
- Demo script: demo_principal_component
Title: Receiver Operating Characteristic example
- Folder: PlotROC
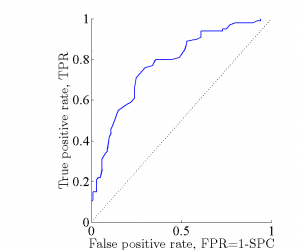
- Description: ROC analysis provides tools to select possibly optimal models and to discard suboptimal ones independently from (and prior to specifying) the cost context or the class distribution. ROC analysis is related in a direct and natural way to cost/benefit analysis of diagnostic decision making. See more detailed description at demo_ROC.html
- Demo script: demo_ROC
Title: Points clusterization
- Folder: PointsClusterization
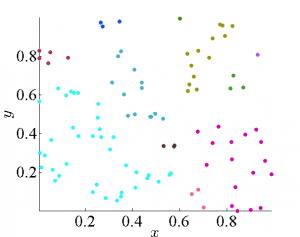
- Description: The demo plots points on 2D-Euclidean space and makes clusterization
- Demo script: Main
Title: Points classification
- Folder: PointsClassification
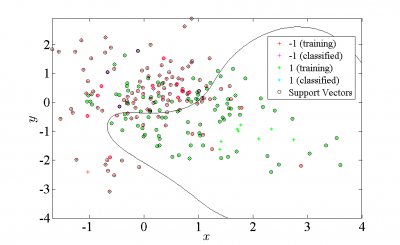
- Description: The demo plots points on 2D-Euclidean space and makes SVM-RBF classification
- Demo script: Main
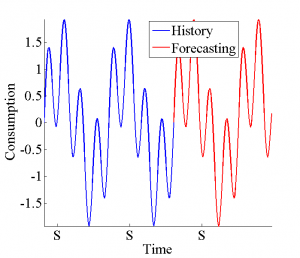
Title: SSA forecasting
- Folder: SSAForecast
- Description: Demo illustrates SSA time series forecasting
- Demo script: demo_ssa_forecast
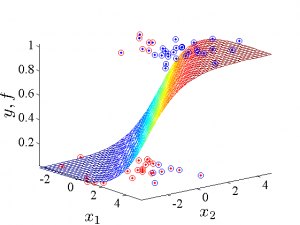
Title: Classification using logistic regression
- Folder: DataGenerationExample
- Description: This demo shows how to compute a separation hyperplane to classify objects. The hyperplane separates one class of objects from another. See more detailed description at demoDataGen.html
- Demo script: demoDataGen
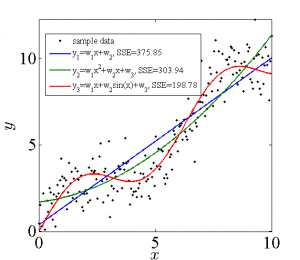
Title: Least Squares Linear Fit
- Folder: LeastSquares
- Description: It shows how to use minimal least squares method to fit data. See more detailed description at demo_least_squares_fit.html
- Demo script: demo_least_squares_fit
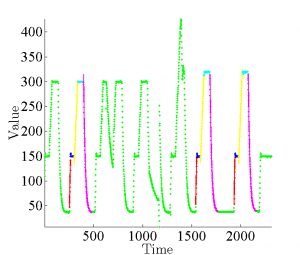
Title: Time series mark up
- Folder: Markup
- Description: Time series has a pattern. The pattern consists of several segments. Each segment could be represented as a simple parametric regression function. The whole pattern is the sequence of concantenated regression models. See more detailed description at demo_markup.html
- Demo script: demo_markup
Title: OutliersDetection
- Folder: OutliersDetection
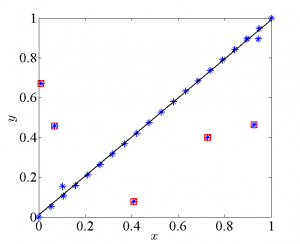
- Description: The demo plots data, fits linear regression and detects outliers
- Demo script: demo_outliers
Title: Phosphor curve differences
- Folder: CurveDifferences
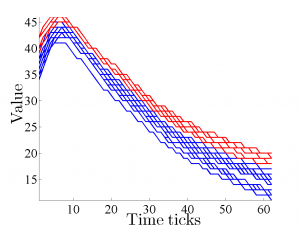
- Description: Phosphor curves 0-1 classification illustration. 0-class curve is blue coloured, 1-class curve is red coloured. See more detailed description at demo_curve_differences.html
- Demo script: demo_curve_differences
Title: Generalized linear models example
- Folder: GLM
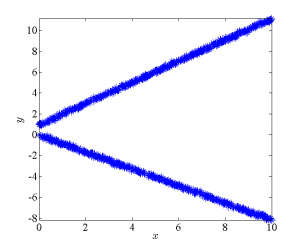
- Description: This demo shows how to deal with the different hypothesis on data generation. The data generation hypothesis here is an assumption about the link function. See more detailed description at demo_GLM.html
- Demo script: demo_GLM
Title: Income vs Lifespan illustration
- Folder: IncomeVsLifeSpan
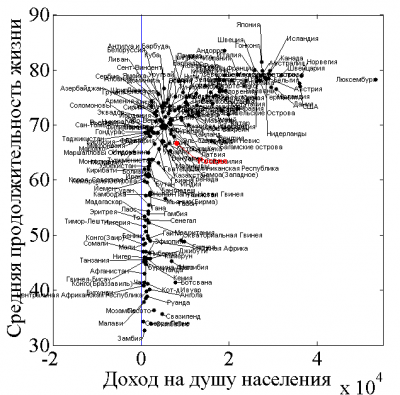
- Description: Demo illustrates dependence between income and lifespan by countries.
- Demo script: IncomeVsLifespan
Title: Indexation demo
- Folder: Indexation
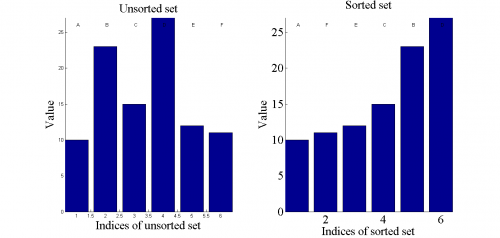
- Description: This demo shows how to use indices of sorted sets and how to recover the unsorted set from the sorted one. See more detailed description at demo_indexation.html
- Demo script: demo_indexation
Title: Linear model generation
- Folder: LinearModelGeneration
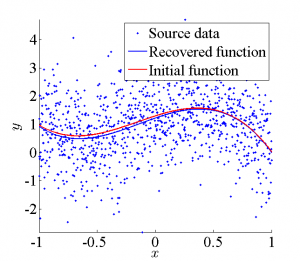
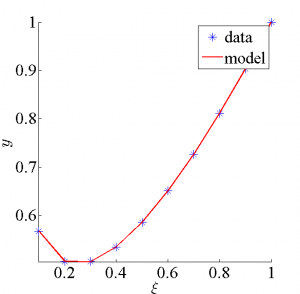
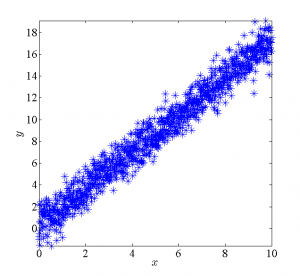
- Description: The problem of model generation is illustrated with a linear regression model of a single variable. See more detailed description at LinModelGen.html
- Demo script: LinModelGen
Title: Volatility smile modelling
- Folder: LinfitOptions
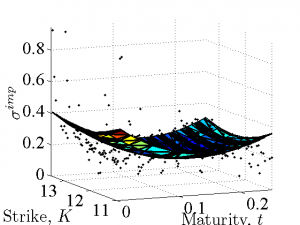
- Description: A volatility smile modeling is one of the actual problems in finance mathematics. Here is an example how to make a regression model of the volatility smile using historical data of an option. See more detailed description at demo_linfit_options.html
- Demo script: demo_linfit_options
Title: Logistic regression example
- Folder: LogisticRegression
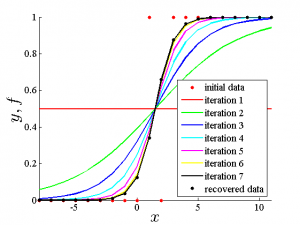
- Description: The Newton-Raphson algorithm is used to obtain the optimal parameters of the regression model. See more detailed description at demo_logistic_regression.html
- Demo script: demo_logistic_regression
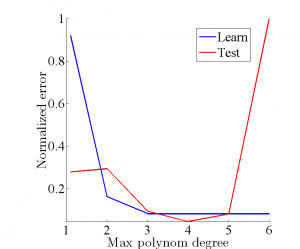
Title: Overfitting curve
- Folder: OverfittingCurve
- Description: Demo illustrates errors on learn (blue curve) and test (red curve) depending on model complexity. The test error increasing shows overfitting.
- Demo script: illustrateOvetfitting
Title: Report example
- Folder: ReportExample
- Description: Report description, place it in the next line after the title. Below this description the Content section will be generated automatically. See more detailed description at report_example.html
- Demo script: report_example
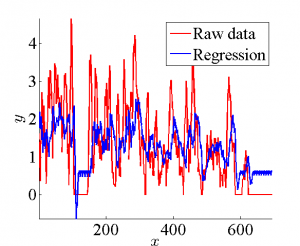
Title: Time series forecasting
- Folder: TargetFunction
- Description: Tune a linear regression model using a common optimization algorithm. See more detailed description at demo_target_function.html
- Demo script: demo_target_function
Title: Features combinations searching
- Folder: Counters
- Description: Demo searches all features combinations for feature selection problem. See more detailed description at demo_cntfeatures.html
- Demo script: demo_cntfeatures
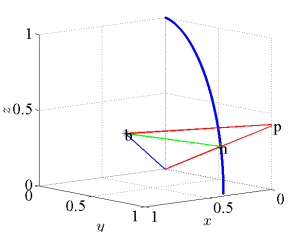
Title: Distance to curve
- Folder: DistanceToCurve
- Description: This demo shows how to find a distance between a point and a curve in Euclidean space.
- Demo script: distance2curve
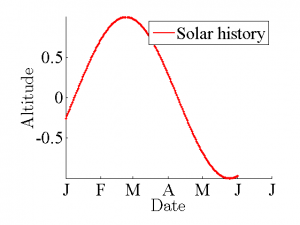
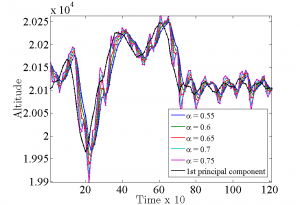
Title: Exponential smoothing
- Folder: ExponentialSmoothing
- Description: Demo shows time series filtering using exponential smoothing method. See more detailed description at ExponentialSmoothing.html
- Demo script: maxim_altimetr
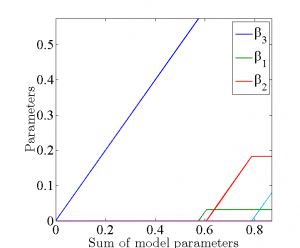
Title: LARS illustration
- Folder: LARS
- Description: Demo illustrates LARS algorithm for feature selection problem. See more detailed description at demo_lars.html
- Demo script: demo_lars
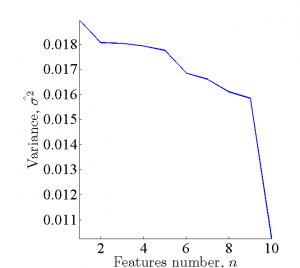
Title: Linear model convergency
- Folder: LinearModelConvergency
- Description: Demo shows regression model residuals variance depending on features/objects number.
- Demo script: illustrations
Title: Online parameters estimation
- Folder: paramsHist
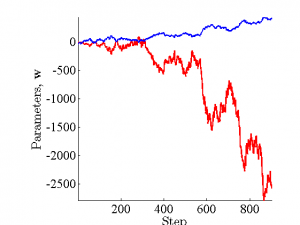
- Description: Demo estimates parameters for a non-linear model for the various periods of time and shows time dependency of parameters.
- Demo script: demoDistrOnline
Title: Parameters estimation histogram
- Folder: paramsHist
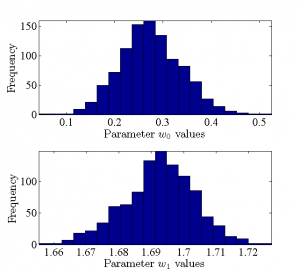
- Description: Demo estimates parameters for random subsamples of model data and plots a histogram of parameters distribution.
- Demo script: demoDistr
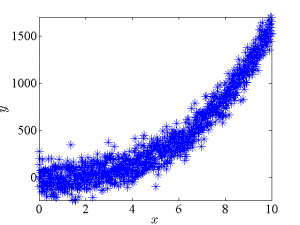
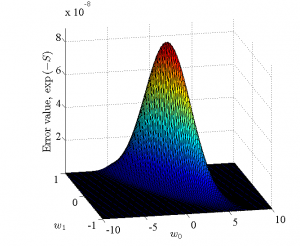
Title: Plot error function
- Folder: ErrorFunVisualization
- Description: Demo simulates data for a regression model (Linear, Polynomial or Mixture), samples parameters and plots error function value for all parameter samples.
- Demo script: demo_ErrFun
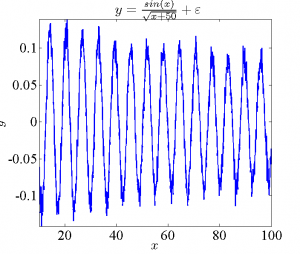
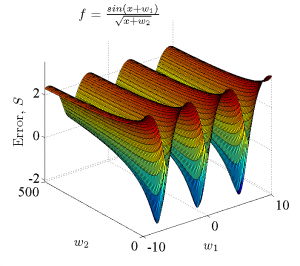
Title: Error function for quasi-periodic data
- Folder: ErrorFunVisualization
- Description: Demo simulates data for a quasi-periodic model, samples parameters and plots error function value for all parameter samples.
- Demo script: demo_QuasiPeriodic
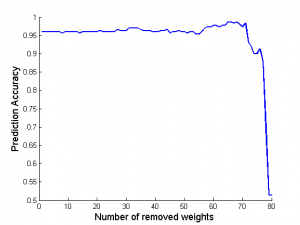
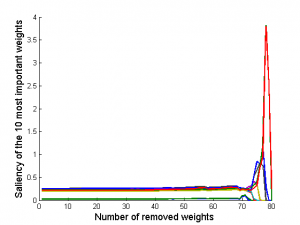
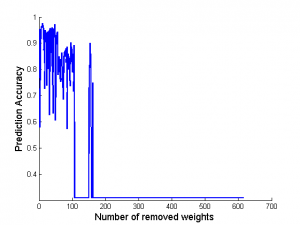
Title: Optimal Brain Damage for softmax classifier
- Folder: softmaxOBD
- Description: Demo simulates OBD - tool for adapting the size of the neural network by removing unimportant weights.
- Demo script: demo_softmaxOBD
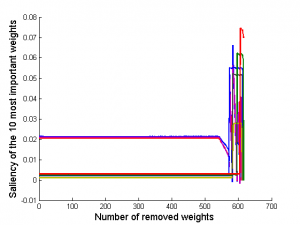
Title: Optimal Brain Damage for 2-hidden layer neural network
- Folder: 2NNOBD
- Description: Demo simulates OBD - tool for adapting the size of the neural network by removing unimportant weights.
- Demo script: demo_2NNOBD
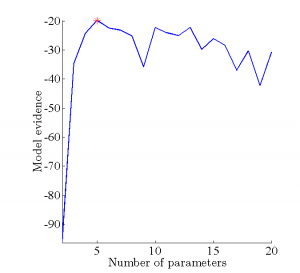
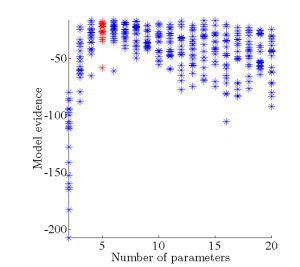
Title: Model evidence estimation for diferent number of parameters
- Folder: ModelEvidence
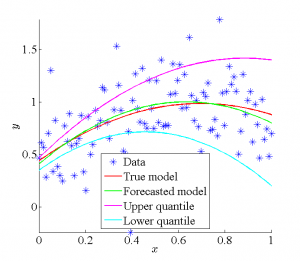
- Description: Demo simulates data for a linear regression model and estimates model evidence depending on different number of parameters. Left figure shows simulated data for 5 parameters in regression model, central figure shows model evidence estimation, right figure shows model evidence estimation for the different subsamples. Real number of parameters equals 5 and the corresponding values of evidence marked with a red symbol.
- Demo script: demo_Evidence
- Demo script: demo_2NNOBD
Title: OLS regression with confidence interval
- Folder: OLSInterval
- Description: Demo simulates data for a linear regression model, fits model coefficients and estimates 90% confidence interval for coefficients.
- Demo script: demo_OLSint
